This is a tutorial developed by Dr. Xuanzhi (Shawn) Zhan and Dr. Derek Cashman in the Department of Chemistry at Tennessee Technological University that teaches the student how to visualize a model of Hemoglobin and identify its key components. This assignment is designed to introduce this software to students in a General Biochemistry I course. You will learn how to find, download and open the published protein structures in the Protein Data Bank (PDB) and visualize them with Chimera X.
In this assignment, we will focus on the protein, Hemoglobin, in humans. Hemoglobin is the oxygen-transporter protein in red blood cells. You will be able to see the three-dimensional structure of this protein from any angle. You can select any residue within the hemoglobin to observe the molecular interactions between individual amino acid residues. You will also observe some surface water molecules that are essential for maintaining the tertiary and quaternary structure of Hemoglobin. You can also learn how the planar heme ligand is chelated in this protein as the prosthetic functional group to bind oxygen.
Procedure
- If you have not downloaded Chimera X, it can be obtained for Windows, OS X or Linux from the Resource for Biocomputing, Visualization, and Informatics (RBVI) at the University of California at San Francisco. The direct link to download the software is here.
- Locate the PDB file from the Protein Data Bank (PDB) using the accession code 6FQF for human hemoglobin. You may either download this directly from the website and open it in Chimera X, or you may type “open 6fqf” on the console in Chimera X to retrieve it automatically.
- The four chains of human hemoglobin will now appear in the Chimera X view window. Select chain A by clicking the appropriate chain identifier in the dialogue box on the right in the “chain information” table. You can also select the chain using the SELECT menu and select CHAIN > HEMOGLOBIN SUBUNITS BETA > CHAIN A. Chain A will be highlighted with a green aurora. Invert this selection by selecting SELECT > INVERT > SELECTED MODELS, and hide the ribbons and atoms using the ribbon and atom tools in the top bar. Only Chain A will be visible now.
- Locate His 92 and His 63 in your model. His 92 binds directly to the iron atom at the center of the heme prosthetic group. Hint: The atoms of the two histidines should already be visible, unless you have already hidden them. If you use the TOOLS > SEQUENCE > SHOW SEQUENCE VIEWER menu option, you will be able to easily locate and select all of the amino acid residues that you wish in the protein and display their atoms. If you select only the atoms of these amino acid residues, you can add a label with the residue number & type using ACTIONS > LABEL > RESIDUES > NAME AND NUMBER.
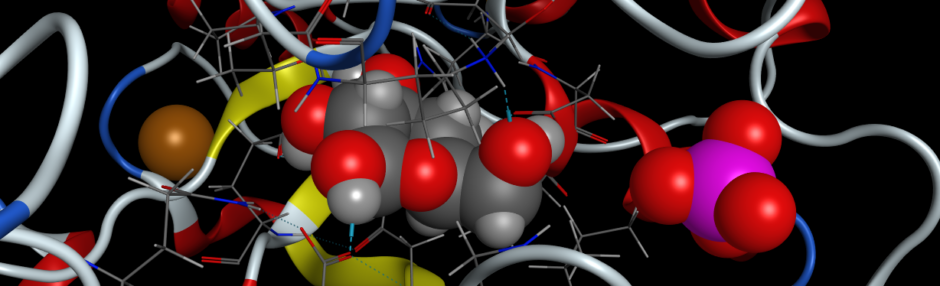
- His 92 interacts directly with the iron atom of the heme group, so to display the heme atoms, select them with SELECT > RESIDUES > HEM.
- His 63 orients a water molecule which chelates to the iron center of the heme. You can view water molecules present using SELECT > RESIDUES > HOH and selecting SHOW ATOMS in the toolbar.
- Why does this only display oxygen atoms with no hydrogens? You can add hydrogens using the TOOLS > STRUCTURE EDITING > ADD HYDROGENS menu function.
- To visualize the hydrogen bonds in the protein, select TOOLS > STRUCTURE ANALYSIS > HYDROGEN BOND from the menu. This will show all of the hydrogen bonds in the entire protein. If you hold the CONTROL and SHIFT keys down at the same time, you can select multiple atoms at once. Select only the atoms of His 63, His 92, the water, and heme and INVERT your selection as you did previously. You can then hide those atoms using the toolbar at the top.
- Measure the distance between heavy atoms (non-hydrogen atoms) in the hydrogen bonds between His 63, His 92, and the heme iron atom. To do this, select TOOLS > STRUCTURE ANALYSIS > DISTANCES. Select two atoms that you want to measure the distance between and click create in the Structure Measurements dialogue box to label the distance between those two atoms in angstroms.
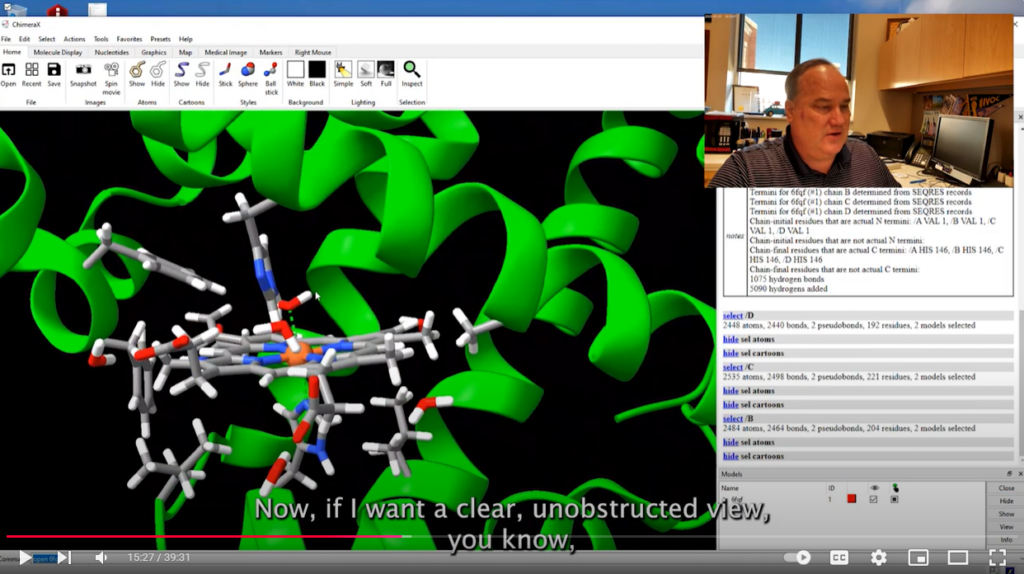
- To generate a figure showing these interactions, rotate the protein so that the heme group appears at the front with the interactions clearly visible and unobstructed by other structures. It may also be advisable to change the background color to WHITE using the ACTIONS > COLOR > ALL OPTIONS menu selection. Note: printing on a white background will use less printer ink and be more economical, however, when visualizing and preparing the molecule, visualizing on a black background will minimize eye strain.
- Save the image in PNG format using either the SAVE button or SNAPSHOT button in the menubar. There is also an option to generate a spin movie in the menubar as well, which will show various rotations of the molecule in 3D space.
- Select a segment of the alpha helix. To do this, select TOOLS > SEQUENCE > SHOW SEQUENCE VIEWER in the menu. In chain A, select all residues between Asn 80 and Lys 95. In the Graphics menubar, select VIEW SELECTED. The selected helix will now be in the center of the display screen. You will notice the intra-strand hydrogen bonds within this helix stabilizing the secondary structure.
- With the atoms of the alpha helix still selected, select SHOW ATOMS in the menubar and all of the atoms of the backbone and side chain are visible.
- To better visualize the backbone atoms, and the NH hydrogen bond donors and CO hydrogen bond acceptors, you may opt to undisplay the ribbon in the menubar.
- Can you determine the number of residues per complete turn of the alpha helix as well as the rise per residue and rise per turn (pitch)?
- To generate a figure showing the alpha helix, rotate the protein so that the heme group appears at the front with the interactions clearly visible and unobstructed by other structures. Save the image in PNG format using either the SAVE button or SNAPSHOT button in the menubar. There is also an option to generate a spin movie in the menubar as well, which will show various rotations of the molecule in 3D space.
- The structure of one of the four individual chains of hemoglobin is structurally similar to myoglobin. To visualize this, Chimera X can be used to superimpose the two structures using the Matchmaker function.
- Open the structure of human myoglobin in Chimera X by typing “open 3rgk” in the command console at the bottom. Next, in the menu, select hemoglobin’s chain A using SELECT > CHAINS > HEMOGLOBIN SUBUNIT BETA > CHAIN A.
- To access Matchmaker, select TOOLS > STRUCTURE ANALYSIS > MATCHMAKER, and select the reference structure 6FQF and the structure to match, 3RGK. Be sure to also select the checkbox, “Also restrict to selection” beneath the reference structure box, and press OK.
- The display will now show both proteins superimposed with their ribbons and atoms closely matching. The RMSD (root-mean-square deviation) is a measure of how closely the two structures match. An RMSD of 0.000 indicates that the atoms in any two superimposed structures are in the exact same positions, so the lower the RMSD, the closer the match between the two proteins.
- To generate a figure showing the superimposed structures, rotate the protein so that the heme groups appear at the front with the interactions clearly visible and unobstructed by other structures. Save the image in PNG format using either the SAVE button or SNAPSHOT button in the menubar. There is also an option to generate a spin movie in the menubar as well, which will show various rotations of the molecule in 3D space.
Questions
- What is the distance in angstroms between the heme iron and His 92 as well as the distance between the heme iron and His 63?
- Analyzing the alpha helical structure you analyzed, what is the number of residues per complete turn of the alpha helix as well as the rise per residue and rise per turn (pitch)? Can you compare your measurements in this structure with published numbers from a Biochemistry textbook?
- How similar are the structures of chain A of hemoglobin and myoglobin? What is the function of both of these proteins? How is the similarity in structure significant to their function?