Introduction
Invertase is an enzyme which catalyzes the hydrolysis of the glycosidic bond of sucrose to give glucose and fructose. The following exercise will provide you with an opportunity to examine the X-ray crystal structure of the invertase enzyme from S. cerevisiae.

You will be using the workstations in the molecular modeling laboratory (Laboratory Science Commons, 2335). The software in this lab you will be using is called MOE 2024.
Familiarize yourself with the MOE 2024 software package. Use the BUILDER tool to build a small molecule (hint: start by building the carbon backbone and then change non-carbon atoms to other types of atoms). You can obtain the 2D chemical drawing of many drug molecules using Google Image search, or on Wikipedia (but don’t copy those into your lab notebook – that’s plagiarism!). Once your model is constructed, apply the AMBER:EHT force field and perform an energy optimization (COMPUTE > ENERGY MINIMIZE). Note: This exercise is purely for your own practice and not a part of this biochemistry experiment (it need not be written up in your lab report).
Part I: Information
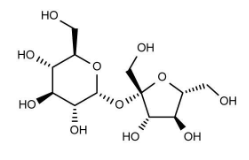
For this research project, start by clearing your MOE 2024 window and constructing a molecule of sucrose, which is the primary substrate of the invertase enzyme. Remember, sucrose has several chiral stereocenters, so make sure that you build that correctly! Recall what wedges and dashes mean from organic chemistry. Also, remember the oxygen atoms (Hint: build everything as a carbon backbone, and then change the appropriate atoms to oxygens).
Steps
- Perform an energy minimization to optimize the geometry of this molecule, as you did before. Since this molecule is a bit more complicated, you may wish to rotate the bonds around the ether oxygen between the glucose and fructose subunits and re-optimize to obtain the configuration with the most favorable energy.
- Record the energy in your notebook.
- Generate a screen capture of the image and paste that in your notebook as well. Save this file in MOE format for later docking calculations.
Part II. Protein Modeling and Visualization
For the second part of this laboratory, you will learn how to visualize and display a 3D model of a protein using MOE 2024.
Steps
- The Protein Data Bank (PDB; http://www.rcsb.org/) is an online repository of X-ray crystal and NMR structures of large biological complexes that can be used for molecular modeling and visualization.
- The PDB is searchable, and each entry can be accessed with an accession code composed of letters and numbers. The PDB accession code for the invertase enzyme for S. cerevisiae is 4EQV.
- Using this accession code, download the 3D coordinates of this enzyme and save it to your local drive.
- You can import these coordinates directly into MOE 2022 using the FILE > OPEN menu and selecting the RCSB PDB option, inputting the code 4EQV into the codes box.
- You may also download the PDB file directly from the website, save it in your home directory, and import it into MOE 2022 with FILE > OPEN as well.
- This structure consists of four sets of identical dimers of invertase. We are only interested in one dimer (labeled as chains A and B). Using the SEQ option in MOE 2022, remove all of the chains from the structure for C through H and save the file as a new file name (e.g. invertase_AB.moe).
- Add ribbons illustrating the peptide chain, and display all atoms using colors illustrating their atom type. Ensure that the ribbon colors are different for each chain A and B.
- Make a screen capture of this protein complex and print it in your notebook.
- Clearly label chains A and B.
Questions
- How many residues are there in chains A and B of invertase?
- Print the sequence of chains A and B in your notebook using the one letter code from the amine to the carboxy terminus.
- Using different colored highlighters (or a color printer), highlight all of the polar residues in red and all of the hydrophobic residues in green.
There is no ligand bound to the crystal structure of invertase that you downloaded. To identify and analyze key features of the protein, we will utilize a tool known as the Protein Frustratometer (http://frustratometer.qb.fcen.uba.ar/). This computational algorithm calculates the protein’s potential energy surface based on energy landscape theory and quantifies the degree of local “frustration” exhibited by various residues. Regions on the surface of the protein with a high degree of frustration may indicate biologically important parts of the protein, such as sites of protein-protein interactions or ligand binding.
Steps
- To initiate a calculation of invertase using the Protein Frustratometer, upload your modified PDB structure of invertase, enter the protein chain (A and B; you may have to run two jobs for both chains), a brief descriptor of your job, and your email address. The calculation should take approximately 20-25 minutes and results will be available in your browser (a link will be emailed to you if you enter your email address).
- In your data analysis screen, find the graph showing the fraction of contacts for configurational frustration.
- Download the frustration data to your home directory when the calculation finishes.
- Identify residues with a configurational frustration density of greater than 20% (red histogram bars – highly frustrated). These residues should be clustered near to other highly frustrated residues.
- Map these highly frustrated residues out on your 3D structure file – color the atoms or ribbons BRIGHT GREEN to indicate that they are “highly frustrated”.
- Undisplay all of the atoms of the protein except for these highly frustrated residues, and label the residue types of these residues.
- Also, indicate these highly frustrated residues on the sequence of the protein that you included in your laboratory notebook as well.
Another analysis of potentially important residues in a protein for protein-protein or ligand binding is to look at highly conserved residues across different species. This is possible with the Evolutionary Trace (ET) algorithm (http://evolution.lichtargelab.org/). Evolutionary Trace performs a multi-sequence alignment and correlates this with the phylogenetic tree.
- To run ET, go to the website above and enter the protein’s PDB identifier (4EQV).
- Download the data files, and in particular, you want to look at the file that contains the ET Ranks – Sorted.
- Identify the residues with the lowest ET Rank (top 25%).
- Color the ribbons associated with these residues RED on your protein (e.g. use a different color than the frustrated residues).
- Select a third color to use if a residue is both highly frustrated and has a low ET score.
- Use the information obtained from the frustratometer and evolutionary trace to propose an active site for docking of sucrose into.
Questions
- How would you describe the overall character of your proposed active site? List the residues in question that you will target docking towards. Hydrophobic, hydrophilic, mixed?
- Measure the distance in Angstroms from several atoms on one side of the active site to the other side to get an idea of the size of the pocket. Show these measurements in your notebook.
Part III. Docking
To determine how the native substrate, sucrose, fits into your proposed active site of invertase, we will dock the model of sucrose that you built in part I into the active site of sucrose. For docking calculations, we will use the MOE 2024 small molecule docking function (COMPUTE > DOCK).
Steps
- Start with the invertase structure that you cleaned up and highlighted frustrated and conserved residues previously. Open that in MOE 2024. Also, open your model of invertase.
- Ensure that the name of the sucrose structure in the sequence editor is something recognizable (e.g. call it sucrose).
- Based on these frustrated and conserved residues, write down the residue names and numbers of each residue that you think might surround the active site. You will use this as input into the Docking algorithm of MOE 2024. Your “Receptor:” is your protein and you should select all the atoms that you believe are the residues surrounding the active site, designated as “Receptor Atoms” in the docking algorithm (frustrated and conserved residues).
- At the top of the page, select your protein under “Receptor:” and “Receptor Atoms:” next to it. Your Site is “selected atoms” after you select all of the atoms that are frustrated and conserved. Leave Pharmacophore and Density blank. Your Ligand is the name of the sucrose molecule and select “Ligand Atoms”.
- Use the default selections for the rest of this menu and press RUN to execute the docking algorithm. You will see sucrose move around in the active site interactively on the screen.
- Once the computer has found several docked poses for sucrose in the receptor, each will appear as a list of five docked poses, sorted by interaction energy. Look at each of these five docked conformations and write down the energy scores in your notebook for each one.
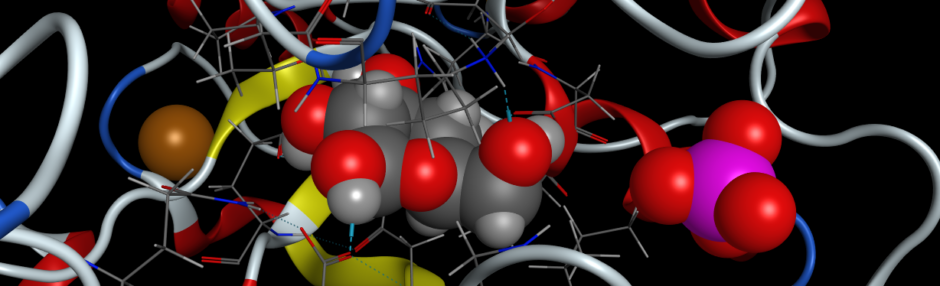
- Change the atoms in the sucrose to ball-and-stick to make it easier to view the ligand in the active site.
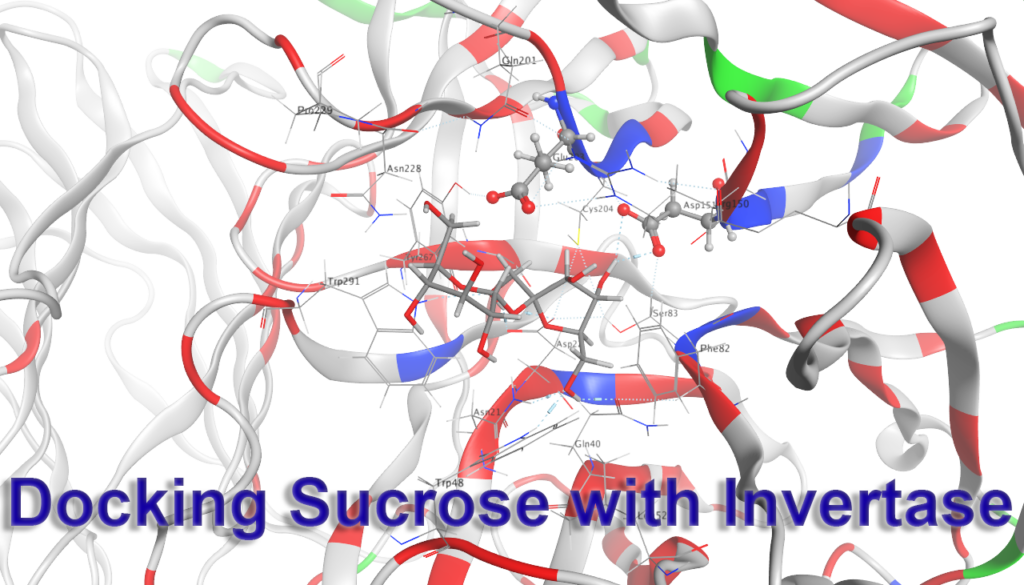
- Identify the residues surrounding sucrose and add residue labels to the residues.
- Change the background to white and print each docked conformation to attach to your notebook.
- Generate a two-dimensional ligand interaction map of the best docked conformation of sucrose in invertase (COMPUTE > LIGAND INTERACTIONS).
- Print this out and paste in your laboratory notebook.
Questions
- For each docked conformation, describe the key non-bonded interaction between the various functional groups of sucrose and discuss this in your notebook. You may wish to measure the length of various interactions (e.g. hydrogen bonds, van der Waal’s forces, etc.).
- How similar are these docked conformations of sucrose in the active site? Are they all interacting with the same residues, or are there differences in the interactions?